AI-Powered Knowledge Graphs: Connecting Enterprise Intelligence at Scale
By Delos Intelligence — 2026-07-12
Enterprise data lives in silos. AI-powered knowledge graphs break down those walls, connecting disparate data points into a unified intelligence layer. Discover how enterprises unlock 40% faster search and 3x better recommendations.
AI-Powered Knowledge Graphs: Connecting Enterprise Intelligence at Scale
Your enterprise has millions of data points across dozens of systems — CRM records, ERP transactions, support tickets, product catalogs, employee profiles, supplier databases. Each system holds a piece of the truth. But the connections between them — the relationships that reveal customer behavior patterns, supply chain risks, or fraud networks — remain invisible.
AI-powered knowledge graphs change this. They map entities and their relationships into a unified, queryable structure that AI can reason over. The result: semantic search that understands intent, recommendations that account for context, and analytics that surface hidden patterns across your entire data estate.
What Is a Knowledge Graph?
A knowledge graph is a data structure that represents entities (people, products, companies, concepts) as nodes and their relationships as edges. Unlike a relational database that stores data in rigid tables, a knowledge graph captures the rich, many-to-many relationships that exist in the real world.
A customer isn't just a row in a CRM table. In a knowledge graph, a customer connects to their purchases, support tickets, company, industry, location, social media activity, and the colleagues who referred them. Each relationship has properties — date, amount, sentiment, channel — that add context.
AI supercharges knowledge graphs by automating entity extraction, relationship inference, and graph reasoning. Instead of manually mapping connections, AI models extract entities from unstructured text, infer relationships from patterns, and reason over the graph to answer complex questions.
The AI Layer: From Data to Intelligence
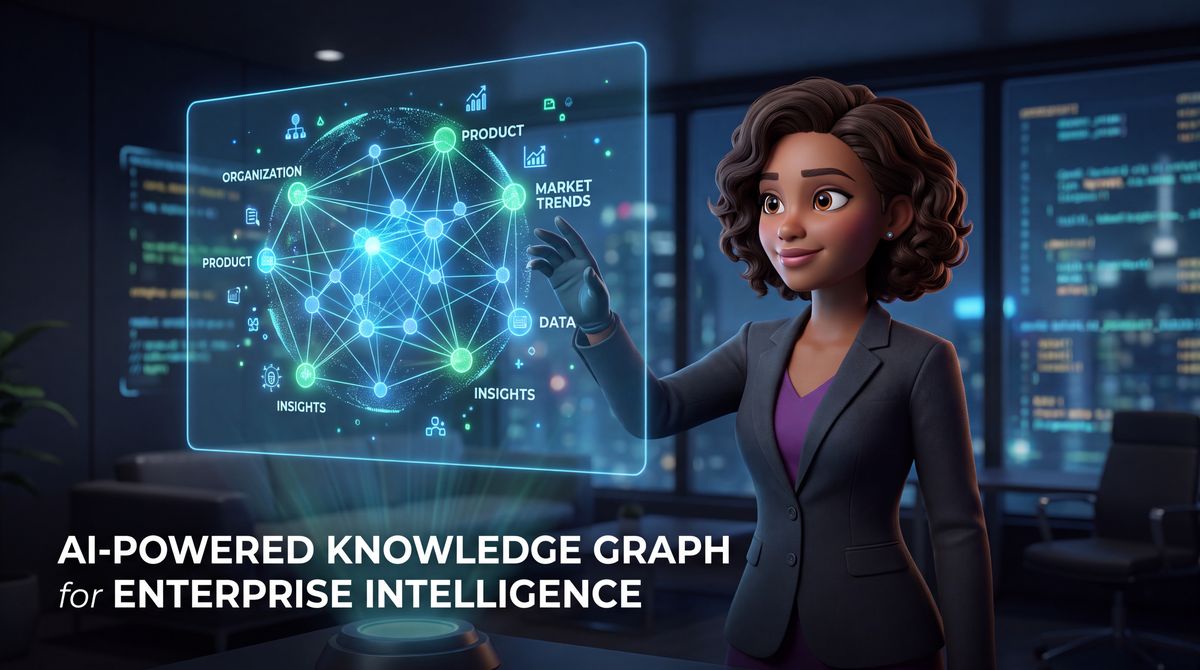
The architecture has four layers:
1. Data Integration
Connect your disparate data sources — CRM, ERP, support, product, HR — into a unified ingestion pipeline. Each source contributes entities and relationships. AI-powered entity resolution merges duplicate records (e.g., "IBM" and "International Business Machines" become one node).
2. Graph Storage
Store entities and relationships in a graph database (Neo4j, Amazon Neptune, TigerGraph, or ArangoDB). Graph databases are optimized for traversing relationships — queries that would require multiple JOINs in SQL execute in milliseconds.
3. AI Reasoning Layer
This is where the magic happens. AI models reason over the graph to:
- Infer hidden relationships: If Company A supplies Company B, and Company B supplies Company C, the AI infers a transitive supply chain dependency.
- Generate embeddings: Convert graph structure into vector embeddings for similarity search and ML tasks.
- Answer natural language queries: "Which customers are most likely to churn based on their support history and purchase patterns?" translates into a graph traversal.
4. Application Layer
Expose the graph through APIs, dashboards, and AI assistants. Semantic search, recommendation engines, and analytics tools consume the graph's intelligence.
Enterprise Use Cases
Customer 360
A global retailer built a knowledge graph connecting 47M customers across 12 data sources. The graph unified purchase history, support interactions, loyalty data, and social media activity. Result: 40% improvement in customer segmentation accuracy and 3x better product recommendations. Marketing campaigns driven by graph insights achieved 28% higher conversion rates.
Fraud Detection
A financial services company used a knowledge graph to map relationships between accounts, transactions, devices, and addresses. The AI reasoning layer detected fraud rings — networks of accounts sharing devices, addresses, and transaction patterns — that individual transaction monitoring missed. The graph caught 60% more fraudulent transactions while reducing false positives by 45%.
Drug Discovery
A pharmaceutical company built a knowledge graph connecting 2.8M chemical compounds, 450K proteins, 180K diseases, and 1.2M research papers. AI models traversed the graph to identify potential drug-target interactions, reducing lead identification time from 18 months to 4 months and cutting early-stage research costs by 35%.
Supply Chain Mapping
A manufacturer mapped its entire supply chain — 12,000 suppliers, 45,000 parts, 180 facilities — into a knowledge graph. When a supplier disruption occurred, the AI identified all affected products, alternative suppliers, and downstream impacts in seconds instead of weeks. Supply chain risk events were mitigated 50% faster.
ROI and Business Impact
The measurable returns are significant:
- 40% faster search: Knowledge workers find information in seconds instead of minutes
- 60% fewer data silos: Unified graph breaks down departmental data walls
- 3x better recommendations: Relationship-aware recommendations outperform collaborative filtering
- 50% reduction in fraud: Graph-based fraud detection catches what rule-based systems miss
- 35% faster time-to-insight: AI reasoning over the graph accelerates analytical workflows
For a 5,000-person enterprise, the annual productivity gain from a knowledge graph is estimated at €8-12M, with ROI achieved within 12-18 months.
Implementation: A Practical Roadmap
Phase 1: Identify Your Use Case (Weeks 1-4)
Don't build a universal knowledge graph on day one. Pick one high-value use case — customer 360, fraud detection, or supply chain mapping. Define the entities, relationships, and queries that matter for that use case.
Phase 2: Connect Your Data (Weeks 4-10)
Map your data sources to the graph schema. Use AI-powered entity resolution to merge duplicates. Start with 2-3 data sources and expand iteratively. The goal is a functional graph, not a perfect one.
Phase 3: Add the AI Layer (Weeks 10-16)
Deploy AI reasoning over the graph. Start with semantic search — it's the fastest to deploy and delivers immediate value. Then add recommendation engines and pattern detection.
Phase 4: Scale and Govern (Weeks 16+)
Expand to additional use cases and data sources. Implement governance: access controls, data lineage, and quality monitoring. The knowledge graph becomes enterprise infrastructure, not a single-use tool.
The Future of Enterprise Intelligence
Knowledge graphs are becoming the connective tissue of enterprise AI. They provide the structured, relationship-aware context that LLMs need to ground their outputs. As AI adoption deepens, the organizations with the richest knowledge graphs will have a structural advantage: their AI will simply know more, reason better, and produce more accurate answers.
The question isn't whether to build a knowledge graph. It's how quickly you can connect your enterprise's intelligence at scale.