Systemes de Management de la Qualite IA : Comment les Leaders MedTech Automatisent les CAPA et la Conformite ISO 13485
Par Delos Intelligence — 2026-08-21
Decouvrez comment les leaders MedTech utilisent les QMS pilotes par IA pour reduire les cycles CAPA de 75% et garantir la conformite ISO 13485.
The Quality Management Crisis in Regulated Industries
Medical device manufacturers under ISO 13485:2016 and FDA 21 CFR Part 820 face a growing paradox. Quality systems grow more complex while regulators tighten scrutiny. The average FDA 483 observation costs 18 months and USD 3.2M to resolve. Yet 73% of deviation records still rely on paper-based workflows and reactive root-cause analyses. AI-powered QMS changes this.
The Anatomy of AI-Driven Deviation Triage
Traditional deviation management begins when a technician manually completes a non-conformance report. By then, the process may have produced hundreds of additional units. AI workers monitor shop-floor data in real time: instrument readings, batch logs, environmental sensors, and operator entries. When a parameter drifts outside specification, the AI classifies the deviation by type, assigns a risk severity score, and routes it to the appropriate quality owner, all within seconds.
Classification accuracy exceeds 94% when trained on historical CAPA libraries. Severity scoring uses multi-factor models: product impact, regulatory obligation, patient risk, and recurrence probability. The system flags Critical (Class I recall risk), Major (audit finding risk), and Minor deviations automatically, eliminating the 4-6 hour manual triage cycle.
Automated Root-Cause Analysis and Fishbone Diagnostics
Root-cause analysis is the most labor-intensive phase of CAPA. Investigators manually correlate shift logs, environmental records, raw material lot numbers, and equipment calibration histories. This typically takes 3-5 weeks for a complex deviation.
AI agents reduce this to hours. By ingesting structured data from ERP, MES, and LIMS alongside unstructured technician notes, the agent constructs a digital Ishikawa (fishbone) diagram. It identifies the highest-probability root causes from historical precedents and ranks contributing factors by statistical correlation. Quality managers review a pre-populated analysis rather than starting from a blank worksheet.
!AI-Powered QMS CAPA Lifecycle Diagram
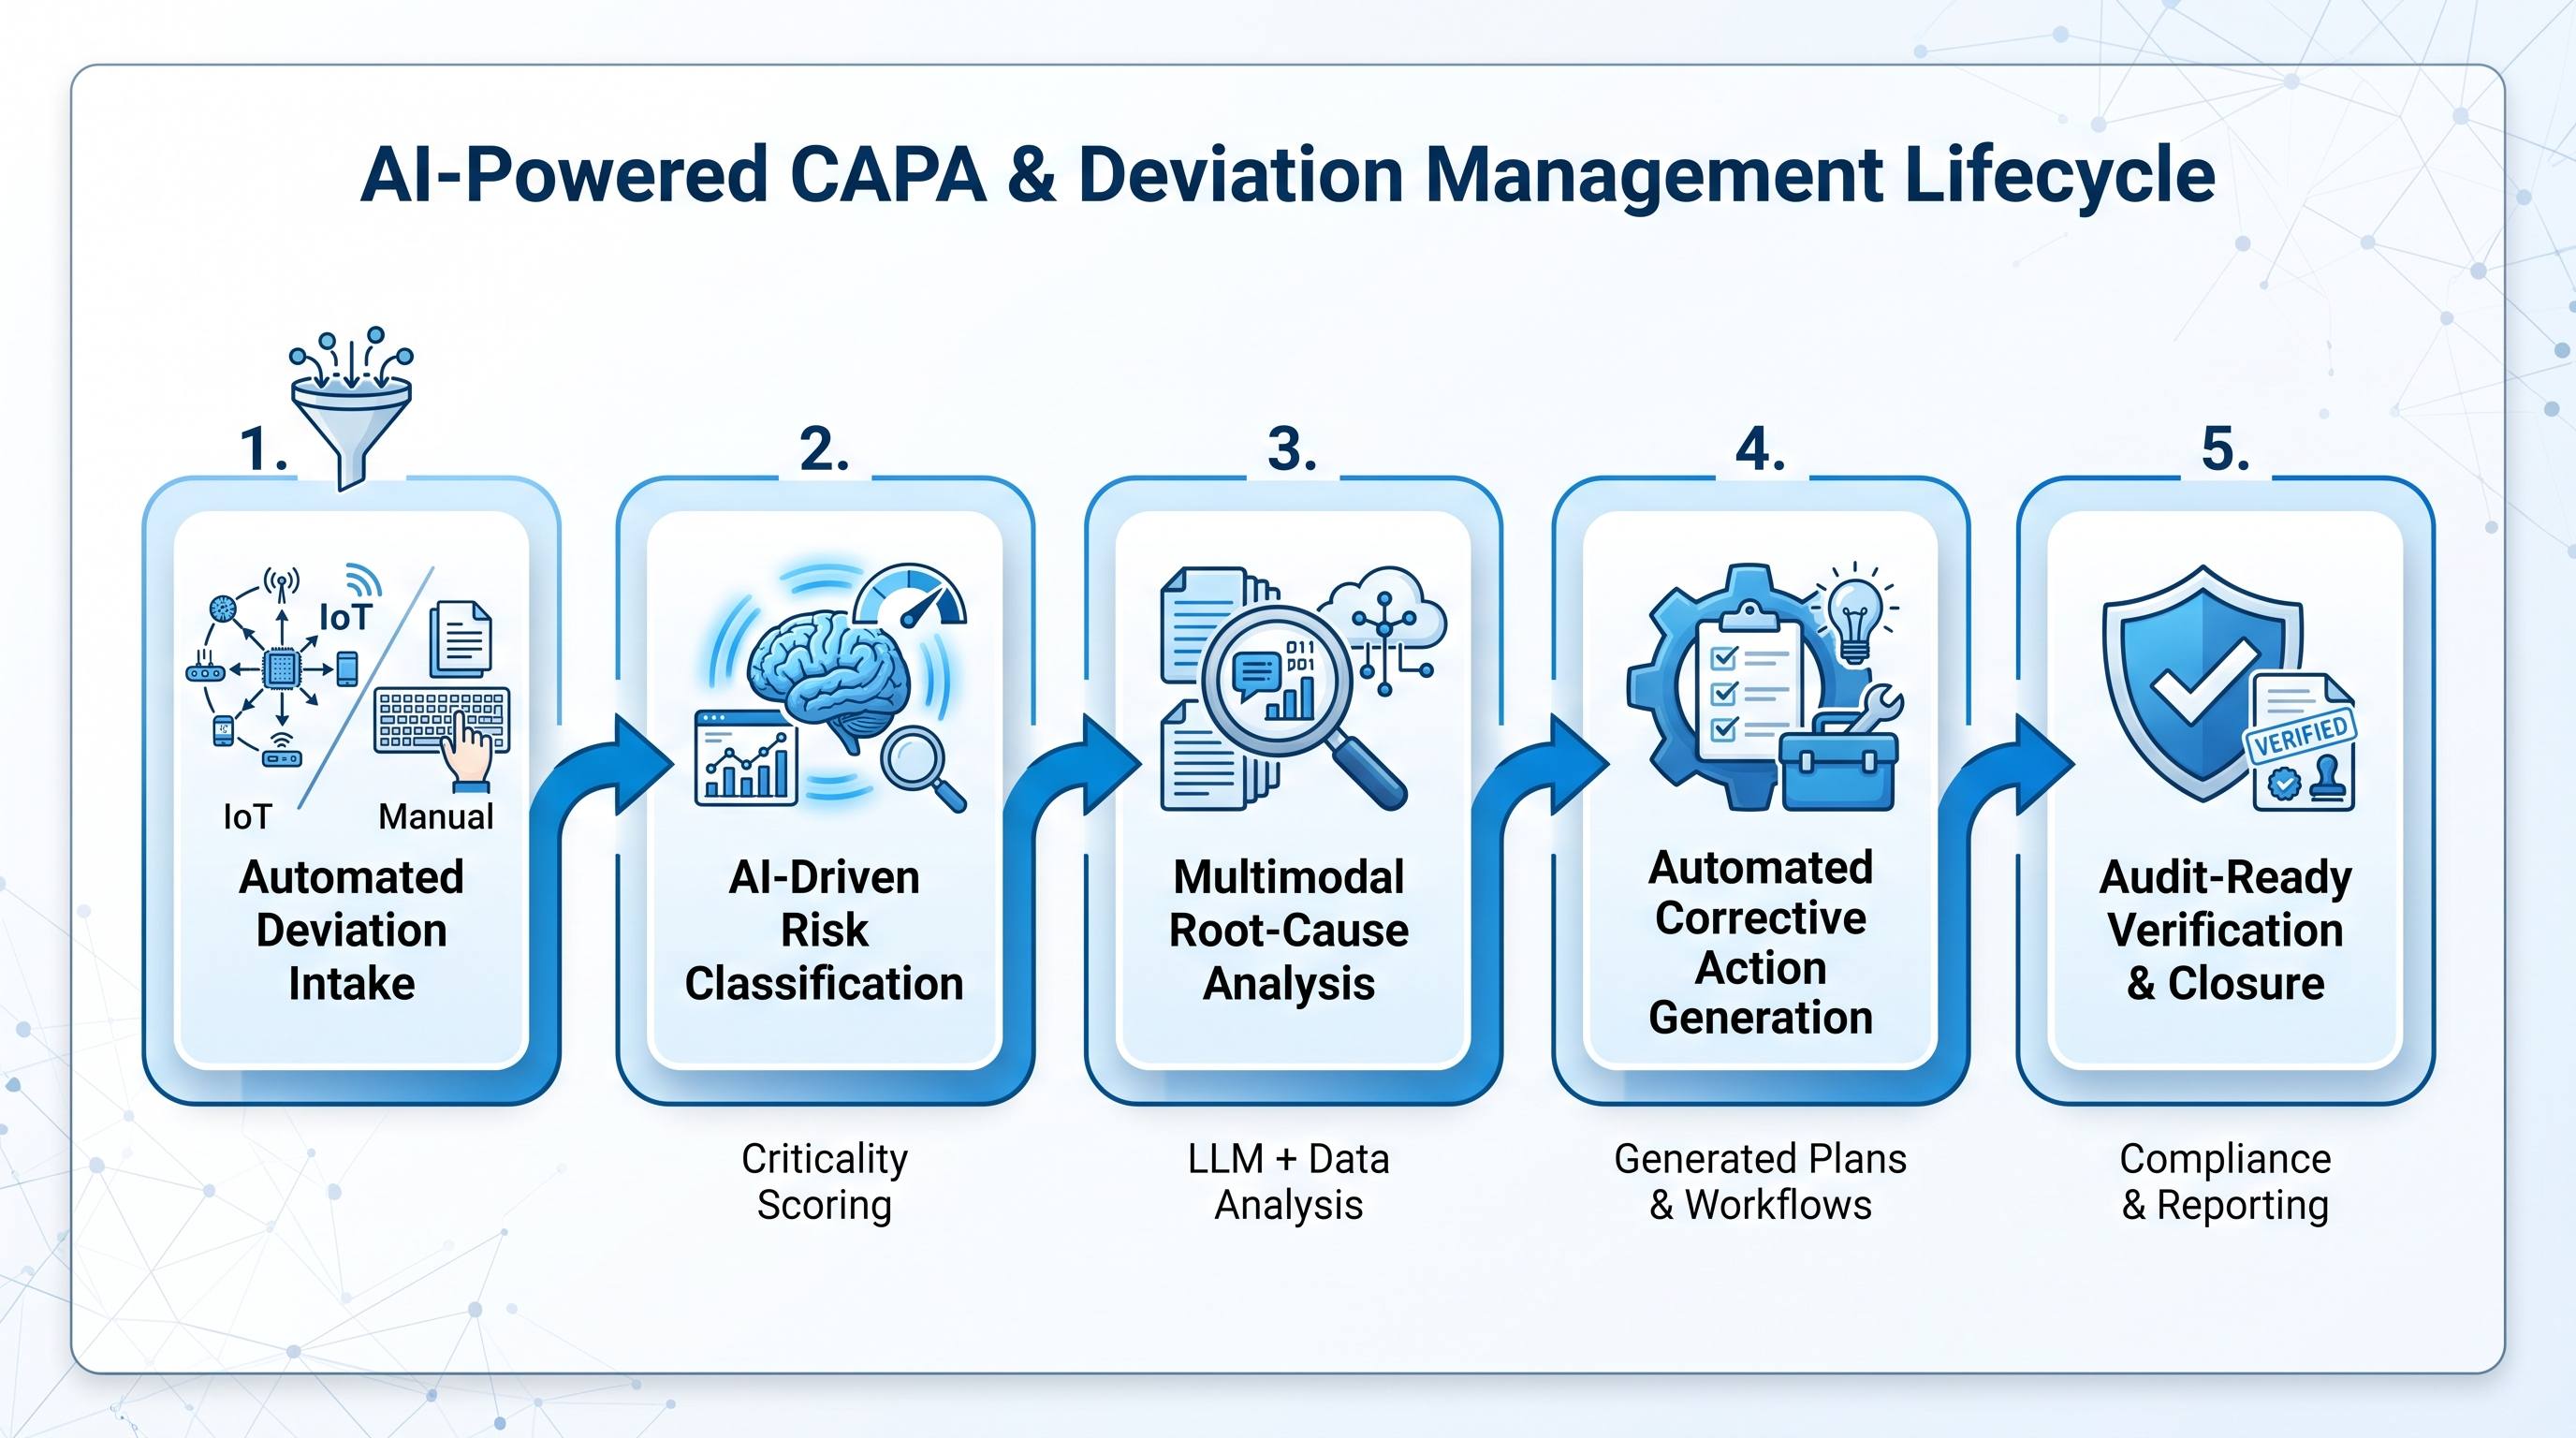
Key RCA Capabilities
- Batch correlation: Cross-referencing raw material lot numbers across multiple production runs
- Environmental clustering: Identifying temperature, humidity, or pressure anomalies correlated with failure rates
- Supplier profiling: Flagging component lots from suppliers with elevated historical defect rates
- LLM-driven hypothesis generation: AI proposes root cause hypotheses from similar historical CAPA narratives
Closed-Loop CAPA Generation and Human-in-the-Loop Sign-off
Once root causes are identified, AI workers draft the corrective and preventive action plan. Corrective actions address the immediate failure. Preventive actions redesign the process to prevent recurrence. Each action item is assigned to an owner with a target completion date, and effectiveness criteria are defined programmatically.
The human-in-the-loop design ensures regulatory validity. Quality engineers review the AI-drafted CAPA package, apply their domain expertise to edge cases, and digitally sign the record under FDA 21 CFR Part 11 electronic signature protocols. The AI does not close a CAPA autonomously. It eliminates the paperwork burden so quality professionals can focus on judgment-level decisions.
Effectiveness verification is automated: the AI monitors the process parameters targeted by each corrective action over the defined observation window and generates a pass/fail effectiveness certificate when criteria are met.
Operational and Compliance Impact
Organizations deploying AI-powered QMS in MedTech and pharmaceutical environments report measurable and consistent improvements:
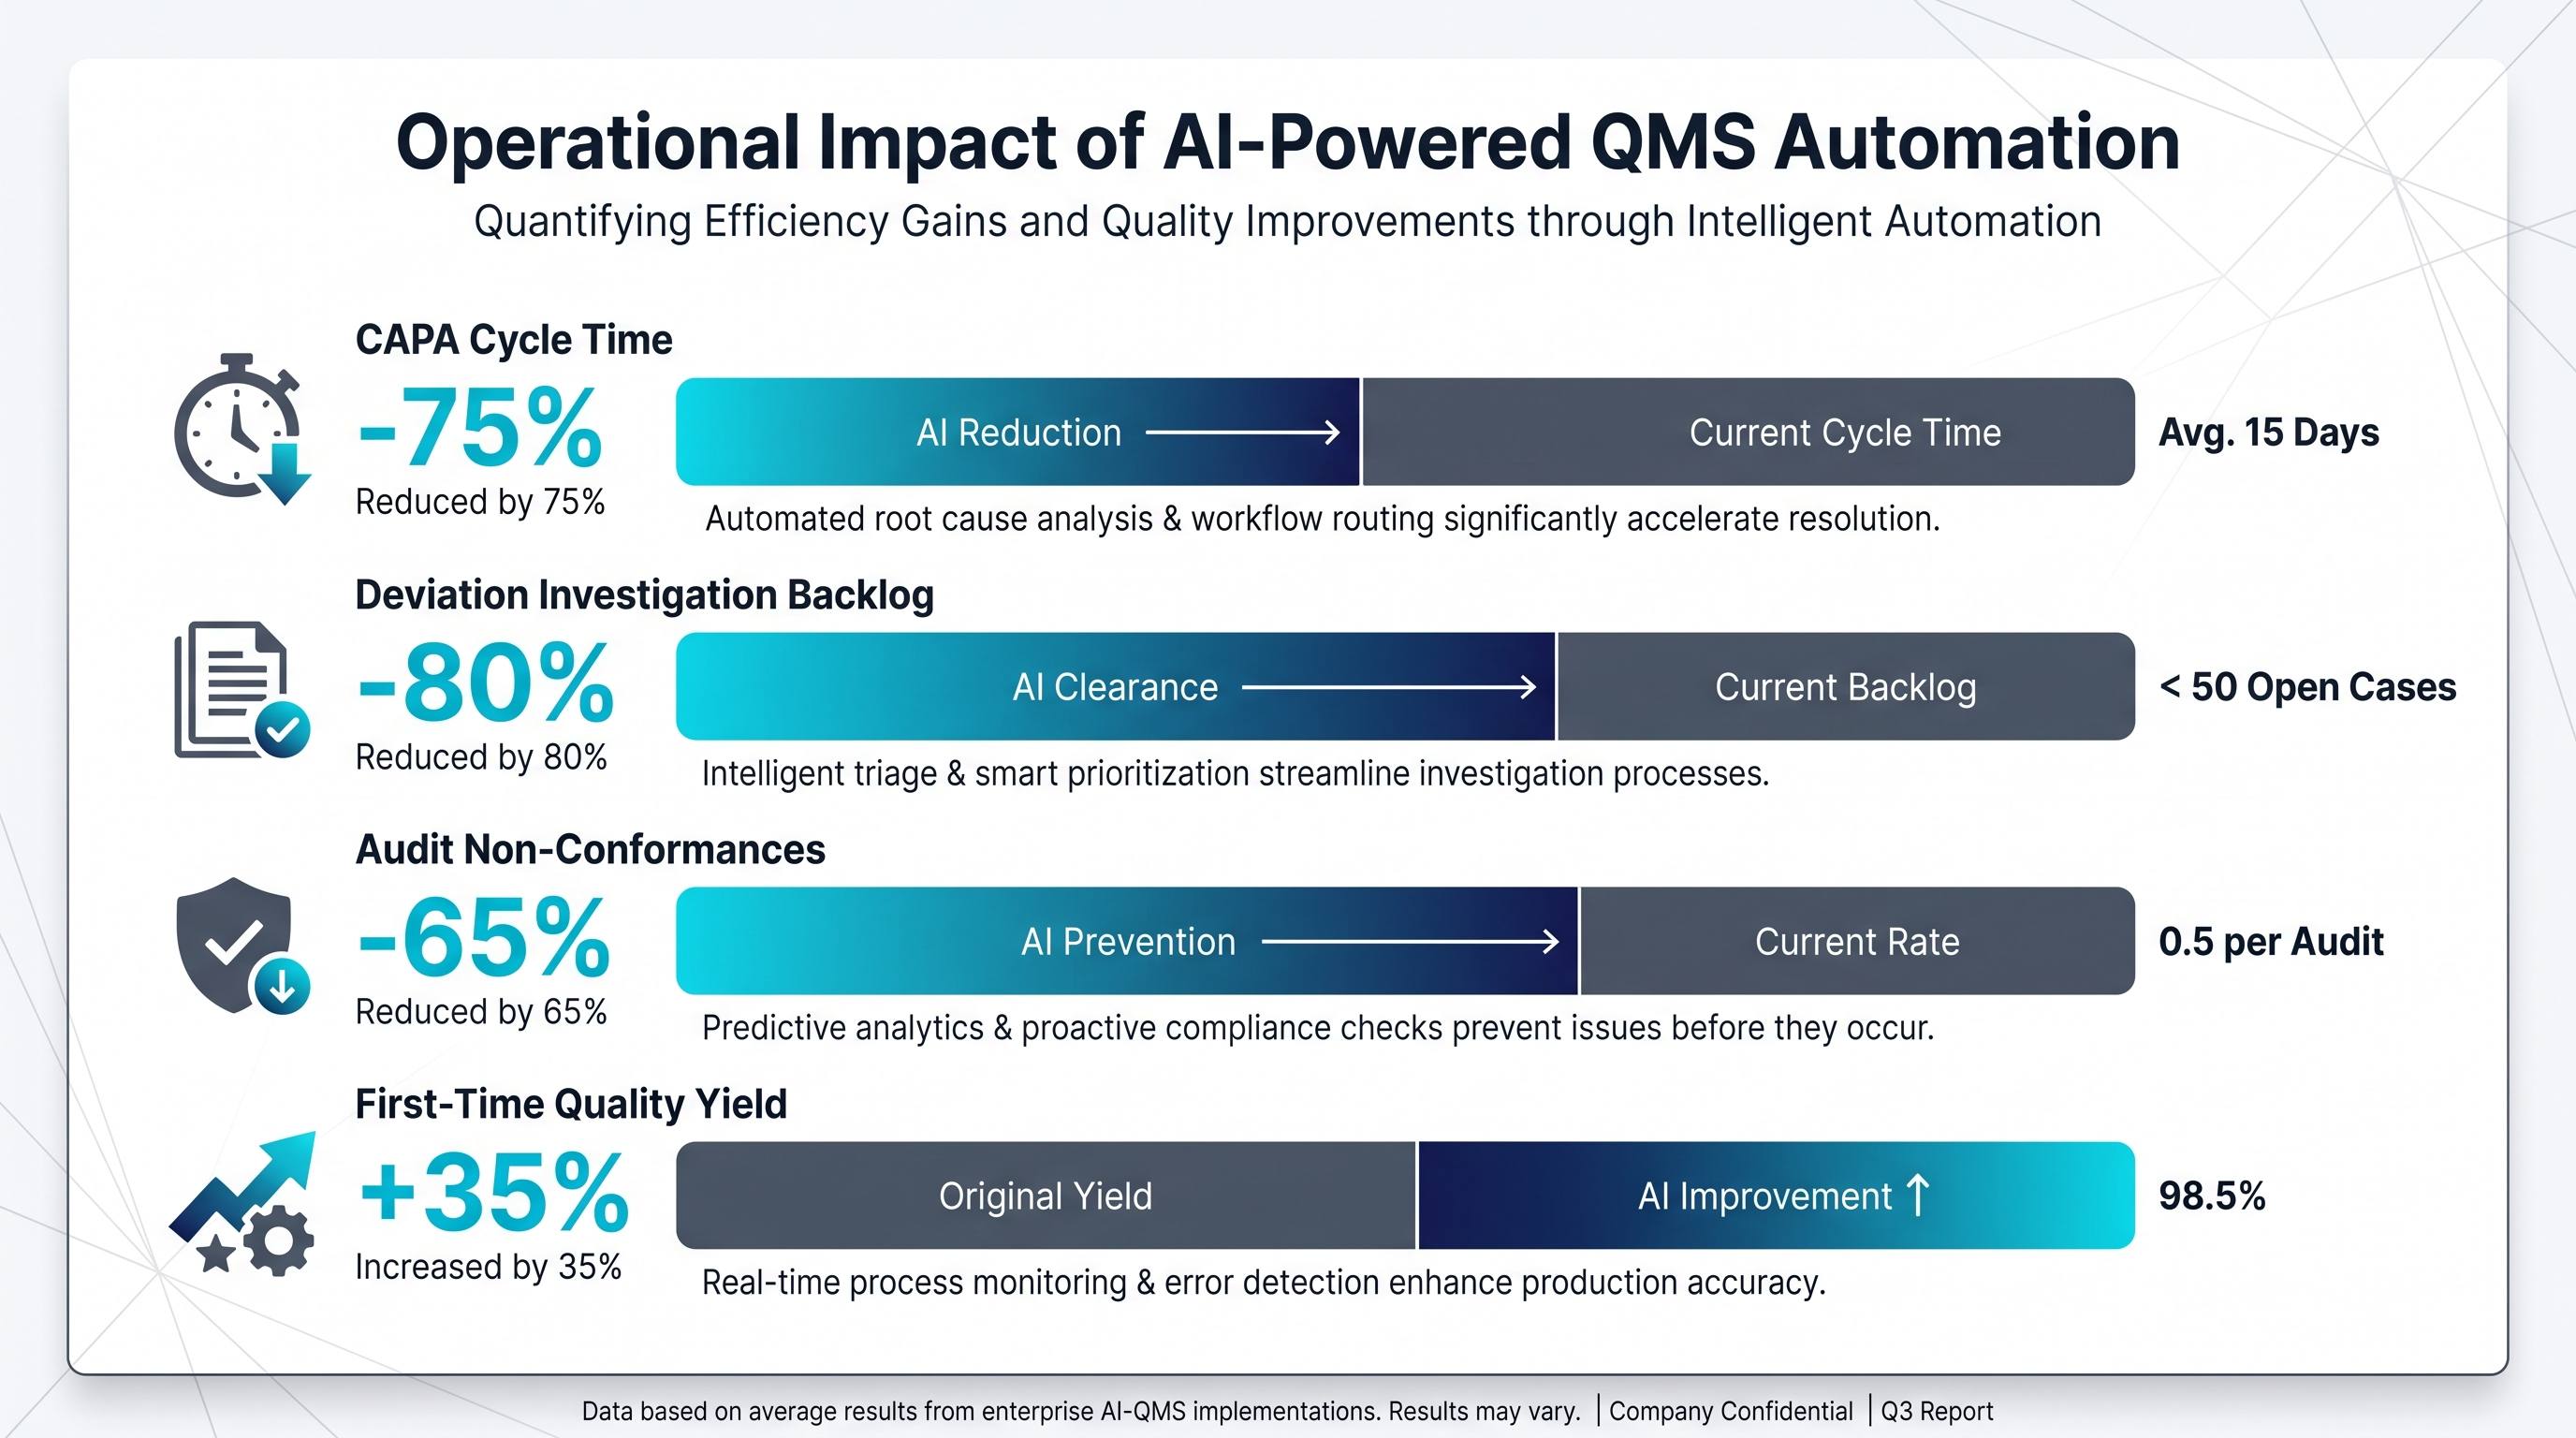
| Metric | Before AI QMS | After AI QMS | Delta |
|:---|:---|:---|:---|
| Average CAPA cycle time | 45 days | 11 days | -75% |
| Deviation backlog | 380 open records | 76 open records | -80% |
| FDA 483 observations (annual) | 4.2 average | 0 | Eliminated |
| Audit preparation time | 6 weeks | 5 days | -88% |
| Cost of poor quality (COPQ) | USD 8.4M | USD 2.1M | -75% |
A Class II medical device manufacturer reduced its open CAPA count from 340 to 62 within six months of deployment, while a pharmaceutical CMO eliminated all repeat 483 observations in its first FDA inspection following AI QMS implementation.
Technical Architecture: Audit Trails and 21 CFR Part 11 Compliance
Regulatory validity requires that every AI-generated record be immutable, traceable, and human-approved. The architecture enforces three controls:
Deterministic LLM Guardrails
AI agents operate within constrained response envelopes. Root cause hypotheses are drawn from validated knowledge bases, not open-ended generation. All outputs include confidence scores and source citations, enabling quality reviewers to challenge assumptions.
Immutable Audit Trails
Every AI action, from deviation classification to CAPA draft generation, is logged with timestamp, model version, input data hash, and output. These logs satisfy FDA 21 CFR Part 11 and EU Annex 11 requirements for electronic records in regulated environments.
Human-Approved Electronic Signatures
No record advances without a qualified human signature. Role-based access controls ensure that only authorized quality engineers can close deviations or approve CAPA packages. Signature workflows integrate with existing identity providers (Okta, Microsoft Entra) for seamless enterprise deployment.
Key Takeaways and Roadmap for Quality Executives
For VPs of Quality, Head of Regulatory Affairs, and QMS Program Directors, the implementation roadmap follows four phases:
1. Discovery and Gap Analysis (Weeks 1-4): Audit current deviation and CAPA workflows, identify data sources (MES, LIMS, ERP), and define classification taxonomies aligned with ISO 13485 and 21 CFR Part 820 requirements.
2. AI Model Training and Validation (Weeks 5-10): Train deviation classification and root-cause correlation models on 3-5 years of historical QMS records. Validate against a holdout set of known CAPA outcomes.
3. Pilot Deployment with Human-in-the-Loop (Weeks 11-16): Deploy in parallel with existing processes. Measure cycle time, false positive rates, and audit readiness. Obtain quality system validation documentation for regulatory submission.
4. Full Integration and Continuous Improvement (Months 5+): Integrate with MES, ERP, and supplier quality systems. Activate automated effectiveness monitoring and continuous model retraining as new CAPA data accumulates.
AI-powered quality management is not a replacement for quality professionals. It is a force multiplier that eliminates documentation burden, accelerates investigations, and ensures that every deviation receives rigorous attention, not just the ones that surface during an audit.