Analyse des Depenses par IA : Comment les Entreprises Reductent les Couts d Approvisionnement de 25%
Par Delos Intelligence — 2026-08-13
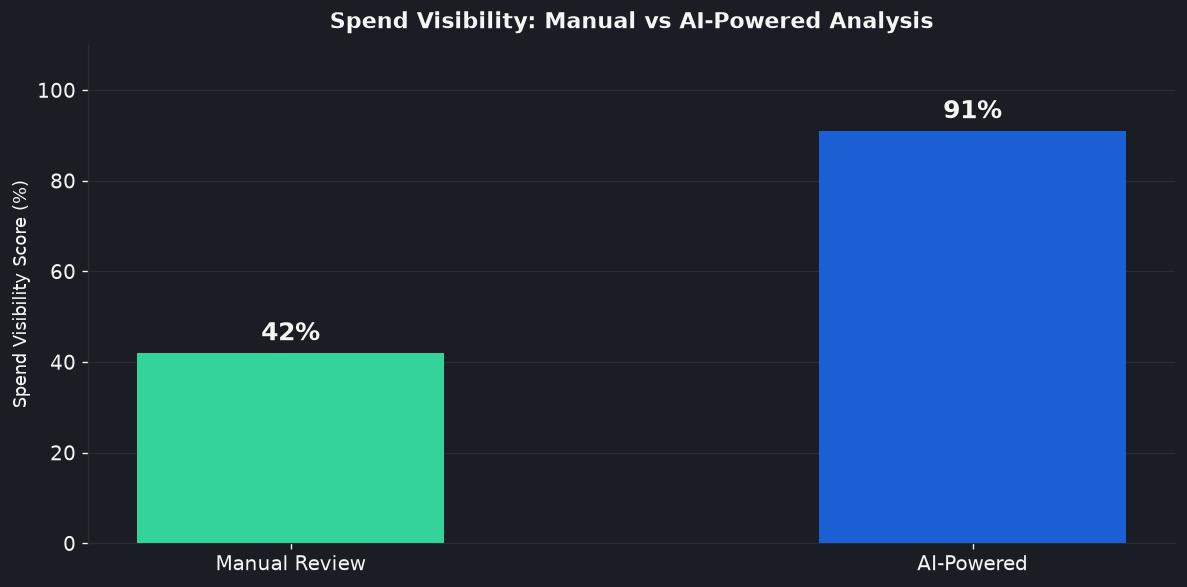
83% des entreprises ne peuvent pas classifier plus de 60% de leurs depenses. L IA atteint 91% de visibilite et identifie 12M en economies.
Why 83% of Enterprises Are Flying Blind on Their Own Spending
Most enterprises think they know where their money goes. They do not. According to a 2025 benchmark study by Spend Matters, 83% of organizations cannot classify more than 60% of their total spend into meaningful categories. The consequences are staggering: unmanaged spend categories typically carry 12-18% in addressable savings.
AI-powered spend analysis achieves spend visibility scores above 90%, identifies savings in days rather than quarters, and cuts procurement costs by an average of 25%.
!Spend Visibility: Manual 42% vs AI 91%
What Is AI-Powered Spend Analysis?
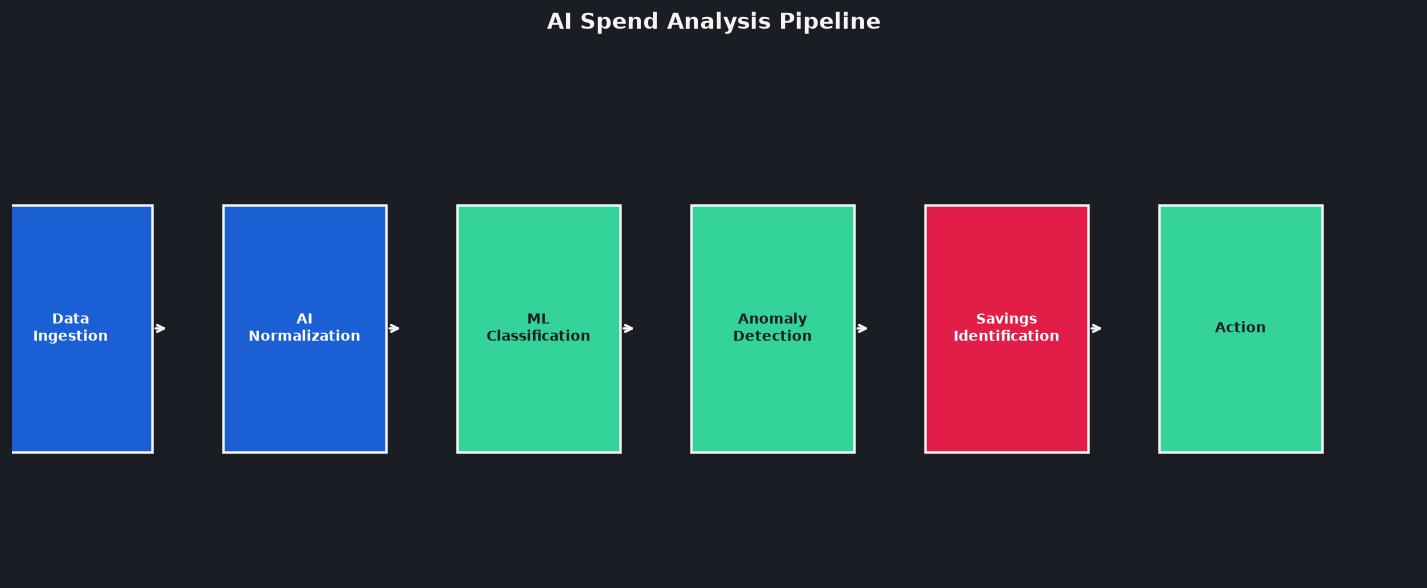
AI-powered spend analysis replaces a rigid manual pipeline with an intelligent automated system:
1. Automated Data Ingestion and Normalization
AI tools connect directly to ERP systems (SAP, Oracle, Microsoft Dynamics), P2P platforms, and unstructured sources. NLP extracts supplier names and amounts from free-text fields. The system normalizes supplier names automatically.
2. ML-Powered Categorization
Machine learning models categorize spend based on transaction patterns and supplier profiles. Accuracy rates exceed 95% after initial training, compared to 60-70% for manual classification.
3. Anomaly Detection
AI continuously monitors spend patterns and flags outliers: supplier invoices 3x larger than average, duplicate payments, off-contract purchases.
4. Savings Opportunity Identification
Beyond classification, AI identifies actionable savings: fragmented supplier spend, maverick purchases, contract compliance gaps.
The Numbers: What Enterprises Actually Achieve
- Spend visibility: Average classification accuracy jumps from 42% to 91% (117% improvement)
- Cost reduction: Average 25% reduction in addressable procurement costs within 12 months
- Savings identification speed: 6-8 weeks reduced to 2-3 days
- Average savings identified: $12M annually for mid-market enterprises
- Maverick spend reduction: Off-contract purchasing drops by 40-60%
- Supplier consolidation: AI identifies 15-20% of active suppliers as redundant
How It Works: The Technology Stack
Data Layer
A spend data lake aggregates transactions from every source. Modern platforms use ELT pipelines that preserve raw data while applying AI models for classification.
Intelligence Layer
Three types of models work together:
- Supplier resolution models using fuzzy matching and NLP
- Classification models (transformer-based) with 95%+ accuracy
- Anomaly detection models using unsupervised learning
Insight Layer
Dynamic dashboards surface opportunities proactively: 'You are spending $2.3M with 14 different office supply vendors; consolidating to 3 could save $340K annually.'
Implementation: A Practical Roadmap
Phase 1: Data Foundation (Weeks 1-4)
Connect to your two largest spend data sources. Focus on getting 70-80% of total spend data flowing into the platform.
Phase 2: Category Deep Dive (Weeks 5-8)
Review the top 10 categories by spend volume. Identify fragmented suppliers, off-contract purchases, and pricing outliers.
Phase 3: Action and Savings Capture (Weeks 9-12)
Launch supplier consolidation RFPs. Implement real-time maverick spend alerts. Set up contract compliance monitoring.
Phase 4: Scale and Optimize (Ongoing)
Add remaining data sources. Expand to indirect spend categories. Integrate with sourcing and contract management platforms.
Common Pitfalls
Waiting for perfect data: Start with what you have. The longer you wait, the more savings leak away.
Treating it as an IT project: Procurement must own the taxonomy, savings targets, and action plans.
Focusing on dashboards over actions: Measure success in dollars captured, not reports generated.
The ROI Case
A mid-market manufacturer with $800M revenue and $320M in procurement spend deployed AI spend analysis in Q1 2025:
- Spend visibility: 38% to 89%
- AI identified $14.2M in addressable savings
- Supplier consolidation in IT services captured $1.8M annually
- Maverick spend reduced by 52% within 6 months
- Total ROI: $4.2M captured in year one vs $180K platform investment
The Bottom Line
AI-powered spend analysis transforms procurement intelligence from a quarterly exercise into a continuous system. The enterprises gaining competitive advantage now are those with the clearest view of their spend. At an average of $12M in identified savings against a fraction of that in platform costs, the real question is how much longer you can afford not to.
Related reading: AI-Powered Procurement | AI Vendor Performance Management | AI Treasury Management
La redaction de cet article a ete assistee par IA.